
BudgetSnapshot
Track income and expenses month by month, see your net balance and savings rate at a glance, set budget targets that warn you, and keep every month in a file you own, without the figures leaving your browser
Guide reviewed 6 October 2026 by Milan Salvi. How we write and correct guides.
Open BudgetSnapshot →Step-by-step help guide and questions and answers for this tool.
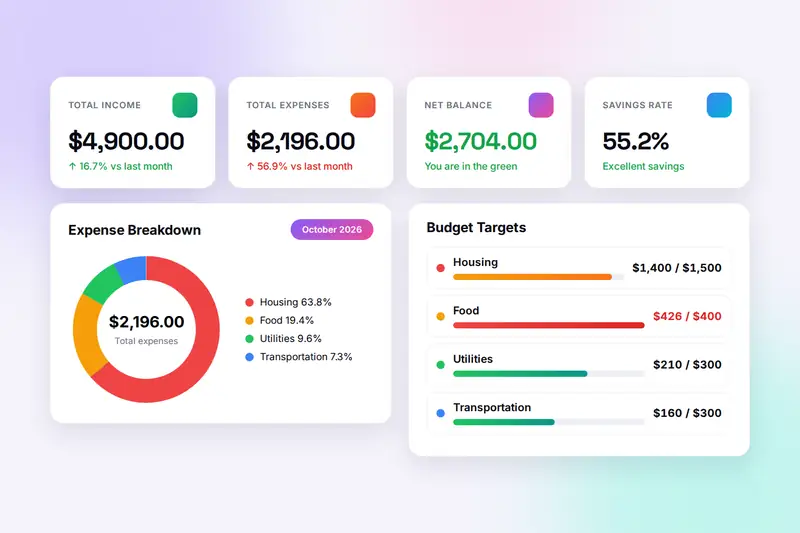
Table of Contents
Overview
BudgetSnapshot is a free monthly budget tracker that runs entirely in your browser. You pick a month, enter your income sources and your expenses by category, and the page turns them into a dashboard: total income, total expenses, the net balance and the savings rate, each with a note against the month before. A donut chart and a row of category bars show where the money went, the top three categories are called out, a comparison card lines up the last three months, and budget targets watch the categories you want to keep in check, with a progress bar and a warning the moment one goes over.
It was built for the monthly reckoning rather than the daily ledger: the evening you sit down with the payslip and the pile of receipts and want one clear picture, not a spreadsheet to maintain. Expenses are entered by category, and adding to a category you already have combines the amounts, so a week of grocery receipts becomes one Food line. Fourteen quick categories cover the usual household headings; anything else is typed in. Every month keeps its own entries and targets, so a year of snapshots builds up and the comparisons start to mean something.
There is no account and no server. The figures are kept in your browser's storage on your own device, Export writes them all to one file whenever you want a copy or a move to another computer, and Print gives a one-page view of the month. Nothing you enter is uploaded, which is the whole point of a budget tool on ZeroDataUpload.
Key Features
Month-by-Month Tracking
Every month and year keeps its own income, expenses and budget targets; two drop-downs move between them, and the selected month is remembered.
Dashboard with Savings Rate
Total income, total expenses, net balance and savings rate as four tiles, with the change against last month and a plain verdict on each.
Categories That Combine
Fourteen quick categories or your own; adding to an existing category adds the amounts, so receipts go in one at a time without arithmetic.
Donut Chart and Bars
An expense breakdown in the colours you chose, with a legend and the top three categories, plus category bars sorted largest first.
Budget Targets with Warnings
A spending limit per category: the progress bar turns amber at 75 percent and red at the limit, and a warning appears when an entry crosses it.
Three-Month Comparison
Total expenses for the month and the two before it, with the percentage change between them, so a trend shows before it becomes a habit.
Export, Import and Print
Every month to one file and back again, on this device or another; a clean one-page print view of the month for a PDF or the fridge door.
Eight Currency Symbols
Dollar, euro, pound, yen, rupee, won, Canadian and Australian dollar, shown in front of every figure; the amounts themselves are never converted.
How to Use
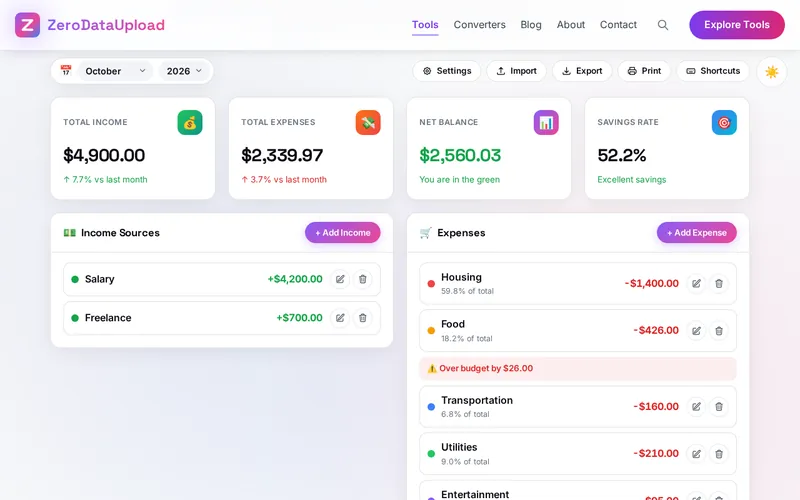
- Pick the month - The toolbar opens on the current month. Choose another month or year to look back or to fill in one you missed.
- Add your income - Click Add Income (or press Ctrl+N), name the source and enter the amount. Add every source, so the savings rate uses the right total.
- Record expenses by category - Click Add Expense (Ctrl+Shift+N), pick a quick category or type your own, enter the amount and choose a colour. Adding to a category again combines the amounts.
- Set budget targets - Open Manage Budgets, choose a category and type the limit for the month. The progress bar and the warnings take it from there.
- Read the dashboard - The four tiles, the donut chart, the bars, the top three and the three-month comparison update with every entry.
- Keep a copy - Export (Ctrl+E) saves every month to one file; Import (Ctrl+I) brings it back or moves it to another device; Print (Ctrl+P) gives a one-page view.
Savings Rate, Categories and Targets
Three ideas carry most of the weight in personal budgeting, and the tool is arranged around them:
- The savings rate - What is left of income after expenses, as a percentage of income. Earn 4,000 and spend 3,200 and the rate is 20 percent. It scales with income, so it says whether spending is keeping pace with earnings in a way the amount saved does not. The tile shows the month's rate with a verdict: 20 percent or more is excellent, 10 to 20 is good, anything above zero is room to improve.
- Categories, not transactions - A budget you can read groups spending into a dozen headings rather than listing every coffee. The tool works at that level: an expense is a category and an amount, and adding to a category combines the two. The fourteen quick categories are housing, food, transportation, utilities, healthcare, insurance, entertainment, shopping, education, savings, debt payment, personal care, subscriptions and other.
- Targets - A common starting point is to put about half of income towards needs, up to 30 percent towards wants and at least 20 percent towards savings and debt. Budget targets turn that into category limits for the month: green under 75 percent of the limit, amber above it, red at the limit, with an over-budget note on the expense line and a warning the moment an entry crosses it. Targets belong to the month, so an unusual month can have its own.
The dashboard's "vs last month" notes and the three-month comparison read the neighbouring months, so the tool becomes more useful with each month you enter. Export after each one and the file is your archive.
Frequently Asked Questions
The questions people ask most about BudgetSnapshot are answered on the tool page, just below the tool. The full list of 32 questions, from storage and privacy to troubleshooting, is in the BudgetSnapshot FAQ, and the help guide walks through every feature step by step.
Privacy & Security
What you earn and what you spend is nobody else's business. BudgetSnapshot has no upload step and no server-side storage: the figures live in your browser's storage on your own device, and the only copies that ever leave it are the files you export yourself.
The tool keeps your entries, targets, currency, selected month and theme choice in the browser, and nothing else. Like every page on ZeroDataUpload, the tool page shows ads through Google AdSense and uses Google Analytics; the Privacy Policy and Cookie Policy explain what those services collect and how the cookie banner controls them. Your budget figures are never part of it.
Ready to try BudgetSnapshot? It's free, private, and runs entirely in your browser.
Open BudgetSnapshot →Related

Last Updated: October 6, 2026